2 Introduction
The Neotoma Paleoecology Database is a public, community curated database containing fossil data from the Holocene, Pleistocene, and Pliocene, or approximately the last 5.3 million years (Williams2018a?). Neotoma stores biological data, and associated physical data from fossil bearing deposits or the depositional environments from which datasets have been obtained. For example, sediment loss-on-ignition and geochemical data from lake sediments, or modern water chemistry data from water bodies from which diatoms have been collected. The database also stores data from modern samples that are used to interpret fossil data.
The initial development of Neotoma was funded by a grant from the U.S. National Science Foundation Geoinformatics program. The inital grant was a collaborative proposal between Penn State University (nsf0622349?) and the Illinois State Museum (nsf0622289?). It had five Principle Investigators, Russell W. Graham, Eric C. Grimm, Stephen T. Jackson, Allan C. Ashworth, and John W. (Jack) Williams.
Initially, data within Neotoma were merged from four existing databases: the Global Pollen Database, FAUNMAP, a database of mammalian fauna (Group1994?), the North American Plant Macrofossil Database, and a fossil beetle database (Morgan et al. 1983) assembled by Allan Ashworth. Although structurally different, these databases contain similar kinds of data, and merging them was quite practical. The rationale for this merging was twofold:
- To facilitate analyses of past biotic communities at the ecosystem level
- To reduce the overhead in maintaining and distributing several independent databases
Because the proxy types that Neotoma integrated were sufficiently diverse, the data model had to focus on the commonalities as the core of the database structure, specifically elements of stratigraphy and chronology. This design facilitated the gradual inclusion of other database types including the addition of ostracode, diatom, chironmid, and freshwater mussel datasets.
The Neotoma database was initially designed by Eric C. Grimm and implemented in Microsoft® Access®. Neotoma was ported to SQL Server, where it was served from the Center for Environmental Informatics at Penn State University. Subsequently the database was ported to PostgreSQL, to support a fully open data ecosystem with an Application-Program Interface (API) that could be integrated into R packages (e.g., Goring et al. 2015) or other programming languages.
Neotoma is now hosted through Amazon Web Services with support from the National Sciences Foundation and CloudBank. Much of the Neotoma infrastructure is open, and clearly defined through a set of open code repositories on GitHub at https://github.com/NeotomaDB.
2.1 Whence Neotoma
 |
|---|
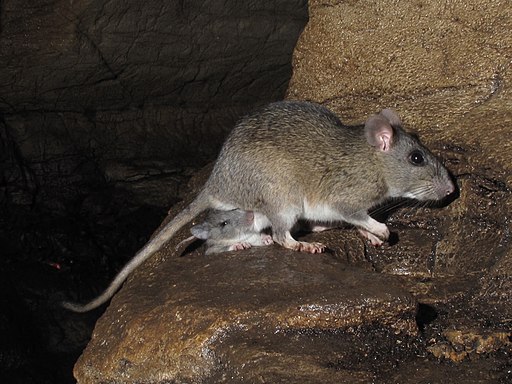
| A packrat of the genus Neotoma. Credit: Alan Cressler, CC BY-SA 2.0 https://creativecommons.org/licenses/by-sa/2.0, via Wikimedia Commons |
Neotoma was called a “Late Neogene Terrestrial Ecosystem Database” in the original NSF proposal. In 2006, when the proposal was written, the Neogene Period included the Miocene, Pliocene, Pleistocene, and Holocene epochs. In 2010 an International Commission on Stratigraphy proposal elevated the Quaternary to a System or Period that followed the Neogene (gibbard2010formal?), and terminating the Neogene at the end of Pliocene. To account for the change in nomenclature, numerous names and companion acronyms were considered, but none engendered enthusiastic support. B. Brandon Curry proposed the name Neotoma, and this name struck a fancy. Neotoma is the genus for the packrat. Packrats are prodigious collectors of anything in their territory, and moreover they are collectors of fossil data. Neotoma packrats collect plant macrofossils and bones, and pollen is preserved in their amberat – hardened, dried urine, which impregnates their middens and preserves them for millennia.
Since its origin, Neotoma has expanded the number of dataset types that are managed, and the time bounds that Neotoma represents. In 2024 the Neotoma Executive Council agreed to remove the temporal limits on datasets within Neotoma, supporting the addition of a new data group arising from the Ocean Drilling Project.
2.2 Rationale
Paleobiological data from the recent geological past have been invaluable for understanding ecological dynamics at timescales inaccessible to direct observation, including ecosystem evolution, contemporary patterns of biodiversity, principles of ecosystem organization, particularly the individualistic response of species to environmental gradients, and the biotic response to climatic change, both gradual and abrupt. Understanding the dynamics of ecological systems requires ecological time series, but many ecological processes operate too slowly to be amenable to experimentation or direct observation. In addition to having ecological significance, fossil data have tremendous importance for climatology and global change research. Fossil floral and faunal data are crucial for climate-model verification and are essential for elucidating climate-vegetation interactions that may partly control climate.
Basic paleobiological research is site based, and paleobiologists have devoted innumerable hours to identifying, counting, and cataloging fossils from cores, sections, and excavations. These data are typically published in papers describing single sites or small numbers of sites. Often, the data are published graphically, as in a pollen diagram, and the actual data reside on the investigator’s computer or in a file cabinet. These basic data are similar to museum collections, costly to replace, sometimes irreplaceable, and their value does not diminish with time. Also similar to museum collections, the data require cataloging and curation. Whereas physical specimens of large fossils, such as animal bones, are typically accessioned into museums, microfossils, such as pollen, are not accessioned, and the digital data are the primary objects, and their loss is equivalent to losing valuable museum specimens. The integrated database that we propose ensures safe, long-term archiving of these data.
Large independent databases exist for fossil pollen, plant macrofossils, and mammals: the Global Pollen Database (GPD), the North American Plant Macrofossil Database (NAPMD), and FAUNMAP. In addition, a database of fossil beetles (BEETLE) has been assembled and integrated into Neotoma. These databases, as with others in the Earth and ecosystem sciences, have become essential cyberinfrastructure. Nevertheless, these resources were originally developed as standalone databases in the early 1990’s. GPD and NAPMD were stored in Paradox® file formats; FAUNMAP in Microsoft Access. Since initial database development, emphasis has been placed on ingest of new and legacy data. However, database and Internet technology have advanced greatly since 1995, and the current relational database software, ingest programs, data retrieval algorithms, output formats, and analysis tools are outdated and minimal. Moreover, the databases are not linked, so that integrated analyses are difficult.
Although GPD, NAPMD, and FAUNMAP were developed independently, they have much in common. The basic data of all three databases as well as BEETLE are essentially lists of taxa from cores, excavations, or sections, often with quantitative measures of abundance. The three databases include similar metadata. The objective of Neotoma is to build a unified data structure that will incorporate all of these databases. The database will initially incorporate pollen, plant macrofossil, mammal, and beetle data. However, the database designed facilitates the incorporation of all kinds of fossil data.
Various teams of investigators have developed databases for paleobiological data that have been project or discipline based, including the four databases to be integrated in this project. However, long-term maintenance and sustainability have been problematic because of the need to secure continuous funding. Nevertheless, these databases have become the established archives for their disciplines and, new data are continuously contributed. However, because of funding hiatuses, long spells may intervene between times of data contribution and their public availability. For example, a number of databases contributed data, but then remained unchanged since the initial contribution. The number of different databases and disciplines exacerbates the problem, because each database requires a lead steward. Consolidation of informatics technology helps address this overhead issue. However, specialists are still essential for management and supervision of data collection and quality control for their disciplines or organismal groups.
The purposes of Neotoma are:
- to facilitate studies of ecosystem development and response to climate change
- to provide the historical context for understanding biodiversity dynamics, including genetic diversity
- to provide the data for climate-model validation
- to provide a safe, long-term, low-cost archive for a wide variety of paleobiological data.
Site-based studies are invaluable in their own right, and they are the generators of new data. However, much is gained by marshalling data from geographic arrays of sites for synoptic, broad-scale ecosystem studies. In order to carry out such studies efficiently, a queryable database is required. Thus, it is much more than an archive; it is essential cyberinfrastructure for paleoenvironmental research. The database facilitates integration, synthesis, and understanding, and it promotes information sharing and collaboration. The individual databases have been extensively used for scientific research, with several hundred scientific publications directly based upon data drawn from these databases. This project will enhance those databases and will continue their public access. By integrating these databases and by simplifying the contributor interface, we can reduce the number of people necessary for community-wide database maintenance, and thereby help ensure their long-term sustainability and existence.
2.3 History of the Constituent Databases
2.3.1 Global Pollen Database
In an early effort, the Cooperative Holocene Mapping Project (Members1988?; Wright1993c?) assembled pollen data in the 1970s and 1980s to test climate models. Although data-model comparison was the principal objective of the COHMAP project, the synoptic analyses of the pollen data, particularly maps showing the constantly shifting ranges of species in response to climate change, were revelatory and led to much ecological insight (e.g. Webb1981?; Webb1987a?; Webb1988b?).
The COHMAP pollen “database” was a set of flat files with a fixed file format for data and for chronologies. FORTRAN programs were written to read these files and to assemble data for particular analyses. Thompson Webb III managed the COHMAP pollen database at Brown University, but as the quantity of data increased, data management became increasingly cumbersome; the data needed to be migrated to a relational database management system. Discussions with E. C. Grimm led to the initiation of the North American Pollen Database (NAPD) in 1990.
At the same time in , the International Geological Correlation Project IGCP 158 (Church1989IGCPP1?) was conducting a major collaborative synthesis of paleoecological data, primarily of pollen, making the need for a pollen database painfully obvious. In the forward to the book resulting from this project (berglund1996palaeoecological?), J.L. de Beaulieu describes the role that the IGCP 158 project had in launching the European Pollen Database (Huntley1993b?). A workshop to develop a European Pollen Database (EPD) was held in in 1. North American representatives also attended, and the organizers of NAPD and EPD commenced a long-standing collaboration to develop compatible databases. NAPD and EPD held several joint workshops and developed the same data structure. Nevertheless, the two databases were independently established, partly because Internet capabilities were not yet sufficient to easily manage a merged database. The pollen databases were developed in Paradox, which at the time was the most powerful RDBMS readily available for the PC platform. NAPD and EPD established two important protocols:
- the databases were relational and queryable
- they were publicly available.
As the success the NAPD-EPD partnership escalated, working groups initiated pollen databases for other regions, including the Latin American Pollen Database (LAPD) in 1994 (ultimately Flantua et al. 2015), the Pollen Database for and the Russian Far East (PDSRFE) in 1995, and the African Pollen Database (APD) in 1996 (Lézine et al. 2021). At its initial organizational workshop, LAPD opted to merge with NAPD, rather than develop a standalone database, and the Global Pollen Database was born. PDSRFE also followed this model. APD developed independently, but uses the table structure of GPD and EPD. Pollen database projects have also been initiated in other regions, and the GPD contains some of these data, including the Indo-Pacific Pollen Database (Herbert et al. 2024) and the Japanese Pollen Database.
## Warning in geom_histogram(stat = "identity", width = 500): Ignoring unknown
## parameters: `binwidth`, `bins`, and `pad`
## Don't know how to automatically pick scale for object of type <integer64>.
## Defaulting to continuous.## Warning: `position_stack()` requires non-overlapping x intervals.
Figure 2.1: Sample age distributions in Neotoma for a subset of Neotoma data. Ages are heavily skewed to samples in the last 10,000 years, and moreso to the near-present.
The pollen databases contain data from the Holocene, Pleistocene, and Pliocene, although most data are from the last 20,000 years (Fig. 2.1). Included are fossil data, mainly from cores and sections, and modern surface samples, which are essential for calibrating fossil data. NAPD data are not separate from the GPD, but rather the NAPD is the North American subset of GPD. EPD has both public and restricted data – a concession that had to be made early on to assuage some contributors.
2.3.2 North American Plant Macrofossil Database
Plant macrofossils include plant organs generally visible to the naked eye, including seeds, fruits, leaves, needles, wood, bud scales, and megaspores. Synoptic-scale mapping of plant macrofossils from modern assemblages (Jackson1997?) and fossil assemblages (Jackson1997?; Jackson2000c?; Jackson2002?) have shown the utility of plant macrofossils in providing spatially and taxonomically precise reconstructions of past species ranges. Although plant macrofossil records are spatially precise, synoptic networks of high-quality sites can scale up to yield aggregate views of past distributions (Jackson1997?). In addition, macrofossils, with their greater taxonomic resolution, augment the pollen data by providing information on which species might have been present, and can resolve issues of long-distance transport (Birks2003?).
The North American Plant Macrofossil Database (NAPMD) has been directed by S.T. Jackson at the . Highest priority has been placed on data from the last 30,000 years, although some earlier Pleistocene and late Pliocene data are included. The database originated as a research database for selected taxa from Late Quaternary sediments of eastern North America (Jackson1997?). In 1994, an effort was initiated with NOAA funding to build on this foundation to develop a cooperative, relational database comprising all of , a longer time span, and all plant taxa.
The structure of NAPMD was adapted from the pollen database and was also stored in a Paradox file format. Although the plant macrofossil database was well served by the data model structure, modifications were made to accommodate different organs from the same species and to deal with the various quantitative measures of abundance. The Plant Macrofossil database also included surface samples, which were not part of the pollen databases at the time, but are useful for the interpretation of fossil data.
2.3.3 FAUNMAP
R.W. Graham, E.L. Lundelius, Jr., and a group of Regional Collaborators organized a project to develop a database for late Quaternary faunal data from the , which the U.S. NSF funded in 1990. This project had a research agenda, and its seminal paper focused on the individualistic behavior displayed by animal species (Group1994?).
Two FAUNMAP databases exist, FAUNMAP I and FAUNMAP II. Both databases were coordinated by R. W. Graham and E. L. Lundelius, Jr. and funded by NSF. Both are relational databases for fossil mammal sites. The data were extracted from peer-reviewed literature, selected theses and dissertations, and selected contract reports for both paleontology and archaeology (all data is currently contained within the Neotoma publications tables). Unpublished collections were not included. Data were originally captured in Paradox but were later migrated to Microsoft Access.
FAUNMAP I contains data from sites in the continental United States (the lower 48 States) that date between 500 BP and ~40,000 BP. Funding for FAUNMAP I ended in 1994, with the production of two major publications by the FAUNMAP Working Group (Group1994?; Group1996?), along with publications from individual members and many others who accessed the database on-line. Graham and Lundelius continued the FAUNMAP project, developing FAUNMAP II with funding from NSF beginning in 1998. FAUNMAP II (faunmapTwo?) shares the same structure as FAUNMAP I but expands the spatial coverage to include and and extends the temporal coverage to the Pliocene (5 Ma). In addition, sites published since 1994, when FAUNMAP I was completed, have been added for the contiguous 48 States. In all, FAUNMAP I and II contain more than 5000 fossil-mammal sites with more than 600 mammal species for all of North America north of Mexico that range in age from 0.5 ka to 5 Ma.
The detailed structure of the FAUNMAP database is described in FAUNMAP Working Group (Group1994?). Sites identified by name and location were subdivided into Analysis Units (AU’s), which varied from site to site depending upon the definitions used in the original publications (e.g., stratigraphic horizons, cultural horizons, excavation levels, biostratigraphic zones). All data (i.e., taxa identified, and counts of individual specimens) and metadata (sediment types, depositional environments, facies, radiometric and other geochronological dates, modifications of bone) were associated with the individual AUs. This structure – analysis units within sites – allows for information to be extracts at the site level, or at the smallest sample subdivision. The analysis unit permits fine-scale temporal resolution and analysis. Similar to the GPD and NAPMD, FAUNMAP contains archival and research tables. Similar to the plant macrofossil database, FAUNMAP contains a variety of quantitative measures of abundance (e.g., MNI, NISP), and presence data are more commonly used for analysis.
2.3.4 BEETLE
Many beetles have highly specific ecological and climatic requirements and are valuable indicators of past environments (morgan1983late?; ashworth2001aapg?; ashworth2004coleoptera?). Coleoptera is one of the most diverse groups of organisms on Earth, and of the insects, perhaps the most commonly preserved as fossils. Allan Ashworth has assembled a database of fossil beetles from . The data, which were recorded in Excel, contain 5523 individual records of 2567 taxa from 199 sites and 165 publications. Metadata include site name, latitude and longitude, lithology of sediment, absolute age, and geological age. The basic data are similar to plant and mammal databases – lists of taxa from sites. The metadata have not been recorded to the extent of the other databases, especially chronological data, but Ashworth has resolved the taxonomic issues and has assembled the publications, so that the additional metadata can be easily pulled together.
2.4 Who Will Use Neotoma?
The existing databases have been used widely for a variety of studies. Because the databases have been available on-line, precise determination of how many publications have made use of them is difficult. In addition, the databases are widely used for instructional purposes. Below are examples of the kinds of people who have used these databases and who we expect will find the new, integrated database even more useful.
- Paleoecologists seeking to place a new record into a regional/continental/global context (e.g., Bell and Mead 1998, Czaplewski et al. 1999, Bell and Barnosky 2000, Newby et al. 2000, Futyma and Miller 2001, Gavin et al. 2001, Czaplewski et al. 2002, Schauffler and Jacobson 2002, Camill et al. 2003, Rosenberg et al. 2003, Willard et al. 2003, Pasenko and Schubert 2004, and many others).
- Synoptic paleoecologists interested in mapping regional to sub-continental to global patterns of vegetation change (e.g., Jackson et al. 1997, Williams et al. 1998, Jackson et al. 2000, Prentice et al. 2000, Thompson and Anderson 2000, Williams et al. 2000, Williams et al. 2001, Williams 2003, Webb et al. 2004, Williams et al. 2004, Asselin and Payette 2005).
- Synoptic paleoclimatologists building benchmark paleoclimatic reconstructions for GCM evaluation (e.g., Bartlein et al. 1998, Farrera et al. 1999, Guiot et al. 1999, Kohfeld and Harrison 2000, CAPE Project Members 2001, Kageyama et al. 2001, Kaplan et al. 2003).
- Paleontologists trying to understand the timing, patterns, and causes of extinction events (e.g., Jackson and Weng 1999, Graham 2001, Barnosky et al. 2004, Martínez-Meyer et al. 2004, Wroe et al. 2004).
- Evolutionary biologists mapping the genetic legacies of Quaternary climatic variations (e.g., Petit et al. 1997, Fedorov 1999, Tremblay and Schoen 1999, Hewitt 2000, Comps et al. 2001, Good and Sullivan 2001, Petit et al. 2002, Kropf et al. 2003, Lessa et al. 2003, Petit et al. 2003, Hewitt 2004, Lascoux et al. 2004, Petit et al. 2004, Whorley et al. 2004, Runck and Cook 2005).
- Macroecologists interested in temporal records of species turnover and biodiversity and historical controls on modern patterns of floristic diversity (e.g., Silvertown 1985, Qian and Ricklefs 2000, Brown et al. 2001, Haskell 2001).
- Archeologists who are studying human subsistence patterns and interactions with their environment (e.g., Grayson 2001, Grayson and Meltzer 2002, Cannon and Meltzer 2004, Grayson in press).
- Natural resource managers who need to know historical ranges and abundances of plants and animals for designing conservation and management plans (e.g., Graham and Graham 1994, Cole et al. 1998, Noss et al. 2000, Owen et al. 2000, Committee on Ungulate Management in Yellowstone National Park 2002, Burns et al. 2003)
- Scientists trying to understand the potential response of plants, animals, biomes, ecosystems, and biodiversity to global warming (e.g., Bartlein et al. 1997, Davis et al. 2000, Barnosky et al. 2003, Burns et al. 2003, Kaplan et al. 2003, Schmitz et al. 2003, Jackson and Williams 2004, Martínez-Meyer et al. 2004)
- Teachers who use the databases for teaching purposes and class exercises (goring?).